|
|
|
|
|
|
|
|
View other TimeConsultant Version 3.0 Features
TimeConsultant now offers Graphs and Chart Reporting at no extra cost!!!!!
All of these new charts and graphs are great for spotting trends in your business!!! Identify your most profitable customers, division, or employees with a few quick clicks.
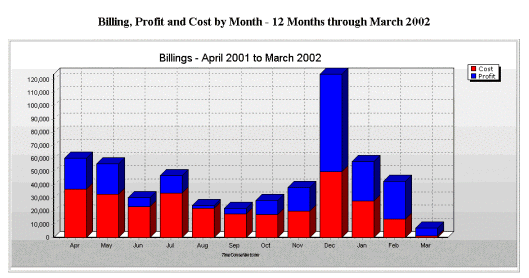
Billing, Profit and Cost Chart - This chart shows Billable Dollars by month for a date range and the profit and cost associated with those Dollars. You can run the report for particular division/practice, client, project or employee(s) The benefit of this report is the graphical view of the status of the company in terms of profitability.
|
|
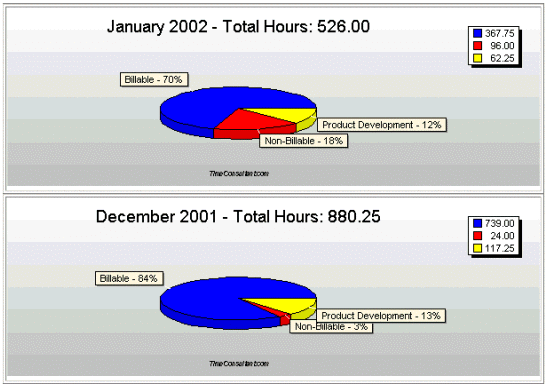
Utilization by Month - This pie chart shows what percentage of hours were billable, non- billable (and any other utilization types you define). The benefit of this report allows a snapshot of knowing what hours are being spent on billable vs. non-billable tasks by employees.
|
|
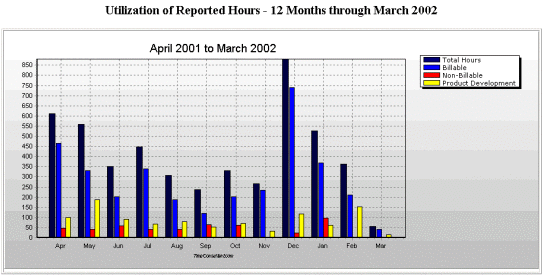
Hours By Month By Utilization - This graph shows total hours billed, what hours were billable, what hours were non billable and any other category you wish to choose. The benefit of this report gives an overall snapshot of where hours are being used within a department, a division or an entire company.
|
|
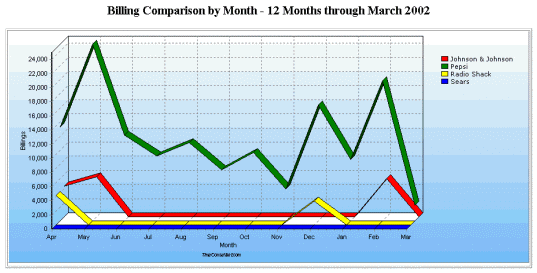
Billing Comparison - This chart will show the comparison of monthly billing totals over a selected time period. The benefits of this chart is to compare the billable dollars between each of your Client/Projects.
|
|
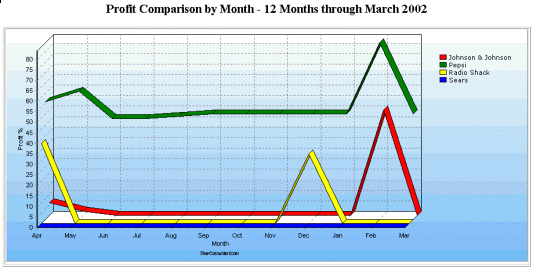
Profit Comparison - This chart will show the comparison of monthly profit percentages over a selected time period. The benefits of this chart is to compare the Profit Percentage between each of your Client/Projects.
|
|
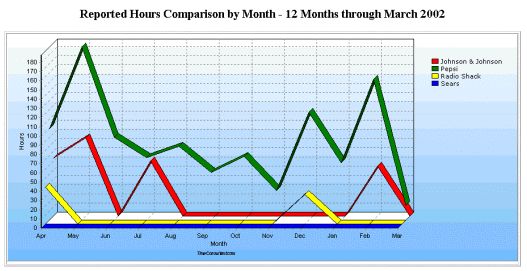
Reported Hours Comparison - This chart will show the comparison of monthly reported hours over a selected time period. The benefits of this chart is to compare the hours reported by for each of your Client/Projects.
|
|
Want to Know More ...
Click here to Request an Online Demo
or Send an email to Sales@TimeConsultant.com